50+ SEO Statistics Every Marketer Should Know (2026)
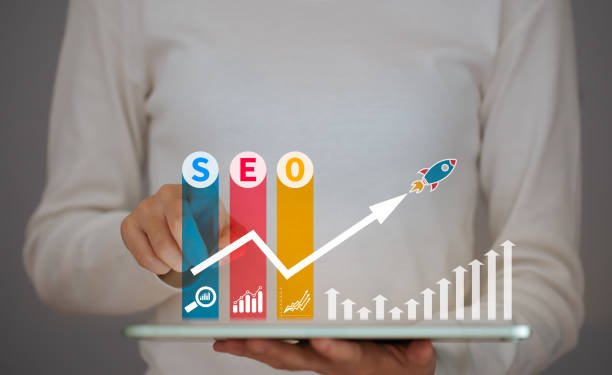
SEO Search Engine Optimization, concept for promoting ranking traffic on website, optimizing your website to rank in search engines or SEO.

50+ SEO Statistics Every Marketer Should Know (2026)

Search engine optimization drives 53% of all website traffic, fuels an $80 billion global industry, and remains the highest-ROI digital marketing channel. With Google processing 8.5 billion searches daily and 96.55% of pages receiving zero organic traffic, the gap between SEO winners and losers continues to widen. Here are 100+ SEO statistics covering organic search, rankings, technical SEO, content strategy, and industry trends for 2026.

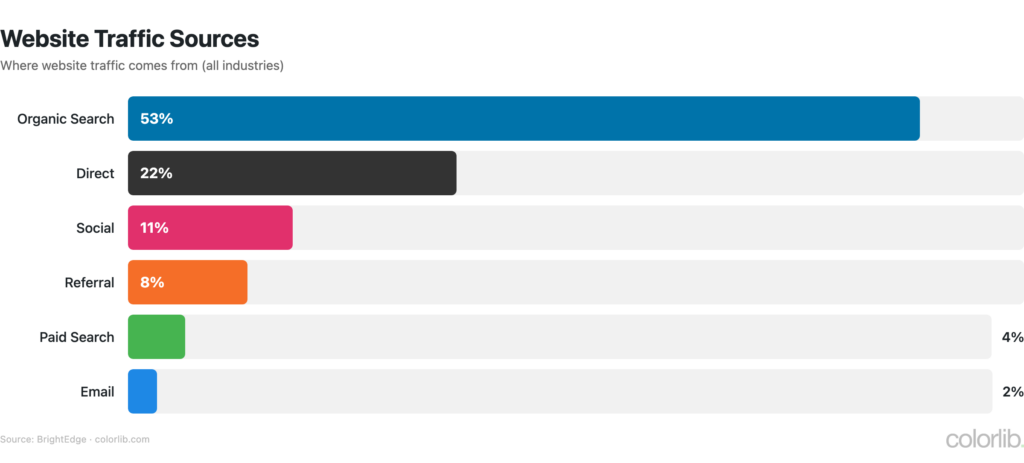
  • 53% of all website traffic comes from organic search (BrightEdge)
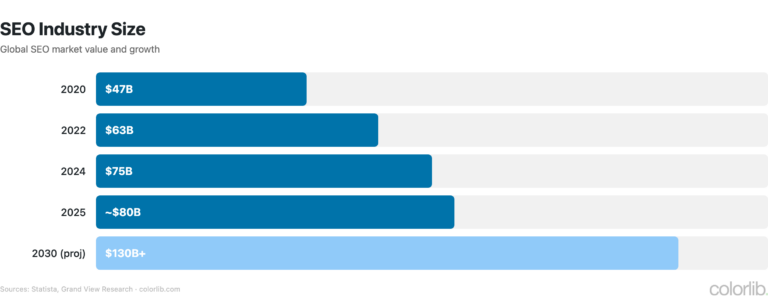
  • Global SEO industry worth $80+ billion in 2026 (Statista)
  • 68% of online experiences begin with a search engine (BrightEdge)
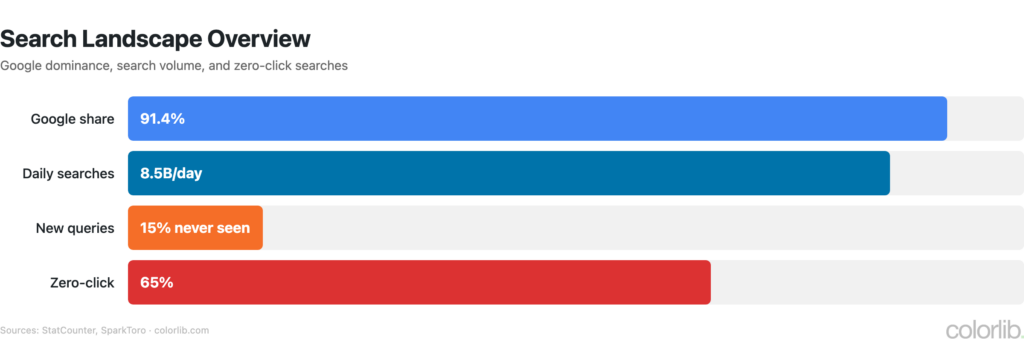
  • Google processes 8.5 billion searches per day (Internet Live Stats)
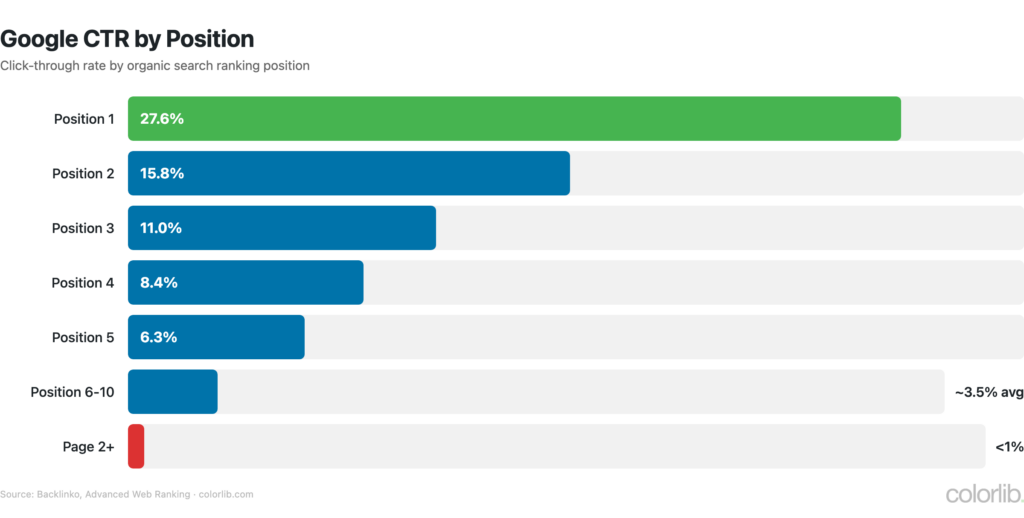
  • The #1 organic result gets 27.6% of all clicks (Backlinko)
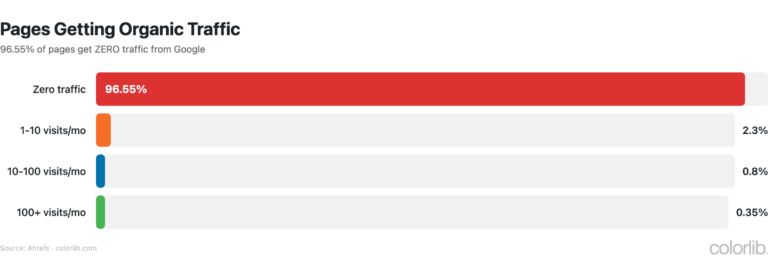
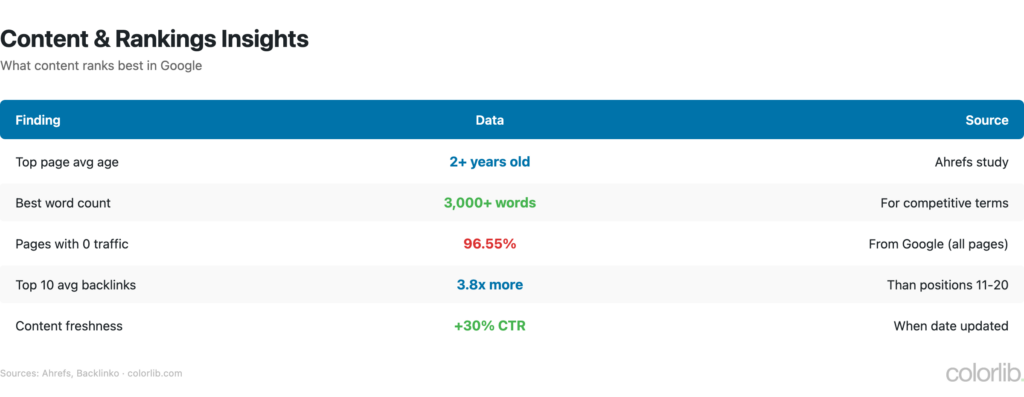
  • 96.55% of all pages get zero traffic from Google (Ahrefs)
  • Average top-ranking page is 2+ years old (Ahrefs)

SEO Industry Size & Growth

MetricValueSource
Global SEO industry size$80+ billionStatista
Projected industry size (2028)$122 billionResearch and Markets
SEO software market$10.3 billionGrand View Research
Average SEO agency retainer$1,500-$5,000/monthAhrefs
Average in-house SEO salary (US)$65,000-$95,000Glassdoor
Businesses investing in SEO61%HubSpot
SEO CAGR (2024-2030)9.6%Grand View Research
ROI of SEO vs. paid ads5.3x higherBrightEdge
  • SEO delivers a 5.3x higher ROI than paid search on average, making it the most cost-effective digital marketing channel
  • The SEO software market alone is valued at $10.3 billion, led by Semrush, Ahrefs, Moz, and Screaming Frog
  • 61% of businesses say improving SEO and organic presence is their top inbound marketing priority
  • Enterprise companies spend $10,000-$50,000/month on SEO, while small businesses average $500-$1,500/month
  • For how CMS platforms affect your SEO, see our CMS market share analysis

Search Engine Landscape

Search EngineGlobal Market ShareDaily Searches
Google91.4%8.5 billion
Bing3.3%~900 million
Yahoo1.1%~300 million
Yandex1.8%~500 million
DuckDuckGo0.6%~100 million
Baidu0.8%~600 million (China)

Source: StatCounter (March 2026)

  • Google processes over 8.5 billion searches per day — approximately 99,000 queries every second
  • 15% of daily Google searches have never been searched before, requiring continuous content creation for new queries
  • AI Overviews now appear on 25%+ of Google queries, fundamentally changing how users consume search results
  • Zero-click searches account for 58-62% of Google queries — users find answers directly on the SERP
  • Featured snippets appear on 12.3% of search queries, providing instant answers above organic results

Organic Traffic Statistics

MetricValueSource
Traffic from organic search53%BrightEdge
Pages with zero Google traffic96.55%Ahrefs
#1 result CTR27.6%Backlinko
#2 result CTR15.8%Backlinko
#3 result CTR11.0%Backlinko
Page 2 results CTR<1%Backlinko
Voice search share of mobile50%+Think with Google
Long-tail keywords share70% of all searchesAhrefs
  • The top 3 organic results capture 54.4% of all clicks, leaving less than half for positions 4-10
  • Long-tail keywords (3+ words) account for 70% of all search queries and have significantly higher conversion rates
  • Voice search now accounts for over 50% of smartphone searches, driving demand for conversational content
  • Pages ranking in position 1 get 10x more clicks than pages in position 10
  • Only 3.45% of all indexed pages receive any traffic from Google at all — content quality and authority are the primary gatekeepers

On-Page SEO Statistics

FactorImpactSource
Title tag with keyword15-20% higher CTRBacklinko
Average top-ranking content length1,447 wordsBacklinko
Pages with meta descriptions5.8% higher CTRAhrefs
Content with images94% more viewsSemrush
Average top-ranking page age2+ yearsAhrefs
Internal links correlationPositive with rankingsAhrefs
Schema markup adoption33% of sitesW3Techs
  • The average top-ranking page is 2+ years old — only 5.7% of newly published pages reach the top 10 within a year
  • Content with at least one image gets 94% more views than text-only content
  • Pages with structured data (schema markup) earn 20-30% higher click-through rates from rich results
  • Title tags containing the target keyword in the first 60 characters perform 15-20% better in CTR
  • Updating and republishing old blog posts with new content increases organic traffic by 106% on average

Technical SEO Statistics

MetricValueSource
Core Web Vitals as ranking factorYes (since 2021)Google
Sites passing all CWV33%HTTP Archive
HTTPS adoption (top sites)95%+W3Techs
Mobile-first indexing100% of sitesGoogle
Average crawl budget waste25-30% on duplicate/thin pagesScreaming Frog
Sites with XML sitemap72%Semrush
Pages with broken links42%Semrush
Average page load time2.5s desktop / 8.6s mobileHTTP Archive
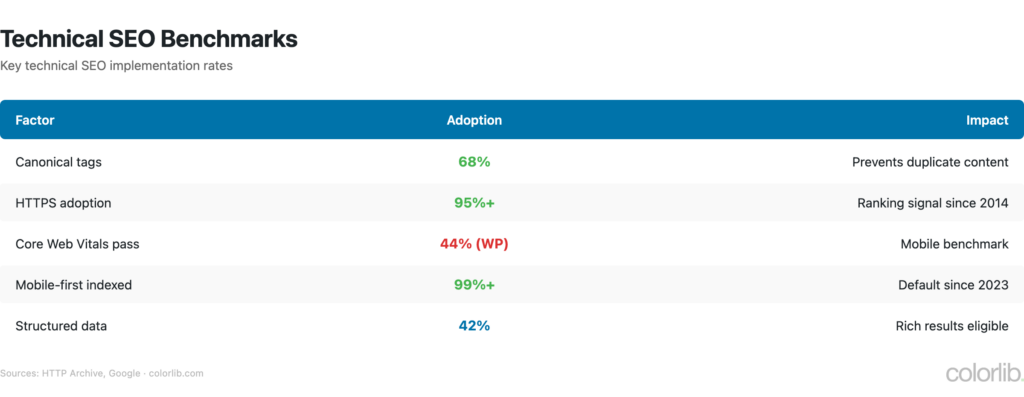
  • Google now uses mobile-first indexing for 100% of websites — desktop-only sites are indexed based on their mobile version
  • Only 33% of websites pass all three Core Web Vitals metrics (LCP, FID/INP, CLS)
  • HTTPS adoption has reached 95%+ among top websites — Google treats HTTPS as a ranking signal
  • The average website wastes 25-30% of crawl budget on duplicate, thin, or orphaned pages
  • 42% of pages contain broken internal or external links, negatively affecting crawlability and user experience

Content & Rankings Statistics

MetricValueSource
Blog posts published daily7.5 millionInternet Live Stats
Posts over 3,000 wordsGet 3x more trafficSemrush
Average referring domains for #13.8x more than positions 2-10Backlinko
Content updates boost traffic+106%HubSpot
Video in search results26% of SERPsSemrush
AI-generated content detectionImproving but not penalizedGoogle
Backlinks remain top ranking factorYesBacklinko
  • The #1 ranking result has 3.8x more backlinks than positions 2 through 10 on average
  • Long-form content (3,000+ words) earns 3x more traffic, 4x more shares, and 3.5x more backlinks than average-length posts
  • Video content appears in 26% of search results, making video SEO increasingly important
  • Google’s stance on AI content: quality matters, not production method — but thin AI content is still penalized
  • For content strategy insights that affect web design, see our web design statistics roundup

Key Takeaways

  1. Organic search dominates web traffic. At 53% of all website traffic, SEO remains the single largest traffic source — exceeding paid search, social media, and direct combined for most industries.
  2. The SEO gap is extreme. The #1 result gets 27.6% of clicks while 96.55% of pages get zero traffic. Ranking on page 1 is essentially a winner-takes-all competition.
  3. Technical SEO is table stakes. With Core Web Vitals as a ranking factor and mobile-first indexing at 100%, site speed and mobile experience are non-negotiable.
  4. AI is reshaping search behavior. AI Overviews on 25%+ of queries and zero-click searches at 58-62% mean SEO must optimize for visibility, not just clicks.
  5. Content quality beats content volume. Long-form, regularly updated content with strong backlink profiles outperforms high-frequency publishing of thin content.
  6. SEO ROI justifies the investment. At 5.3x the ROI of paid ads, SEO is the most cost-effective marketing channel — but requires patience, as top-ranking pages average 2+ years old.

Sources

Comments

No comments yet. Why don’t you start the discussion?

Leave a Reply

Your email address will not be published. Required fields are marked *